
Are Americans Too Pessimistic About Their Financial Futures?
History says they are.


A National Malaise
In a recent survey conducted by the University of Chicago’s National Opinion Research Center, one of the questions was, “Do you feel confident or not confident that life for our children’s generation will be better than it has been for us?” Only 21% of interviewees said yes.
To an extent, the response reflected general dissatisfaction. However, as that question followed inquiries that had addressed strictly financial topics, receiving similarly pessimistic replies (for example, only 28% believed that “people like you and your family have a good chance of improving your standards of living”), the sentiment was representative.
Household Income: On the Rise
I deeply disagree with the public’s conclusion. Past performance imperfectly signals fund returns, but it has reliably predicted the direction of the U.S. economy. Each generation of Americans has been wealthier than the one before it.
The following chart shows the recent experience. It depicts the change in U.S. household income from 1967 through 2021 for several income percentiles. Roughly speaking, the initial half of the period captures the prime working years of the children of the Great Depression, while the other half displays the younger baby boomers. That is, the left side of the chart shows my parents’ generation, and the right side shows mine.
(Technical notes: All dollars are expressed in 2021 terms, to eliminate the effects of inflation.)

The trend has been up—for all. To be sure, the rich have indeed become richer. The popular lament is no myth. The nation’s economic bounty has trickled down disproportionately. Those atop the wealth pyramid drank the deepest, followed by the middle class. Meanwhile, the nation’s poorest households have tasted the least.
Nevertheless, they have tasted. (Although it is difficult to read in the graph, household income for the 80th percentile increased to $28,007 from $21,337 through the period.) The data support claims that poor—and to a lesser extent, middle-class—citizens have not participated enough in the rising economic tide. That criticism is valid. But it is another thing altogether to extend the argument by contending that Americans are worse off than before. They are not.
A Consistent Pattern
The next chart tests whether the improvement in household incomes occurred throughout the 55-year period, or if they owed mostly to the early results. The latter, after all, would justify the public’s concern. The blue bars portray the change during the first half of the period, while the orange bars show the second half.
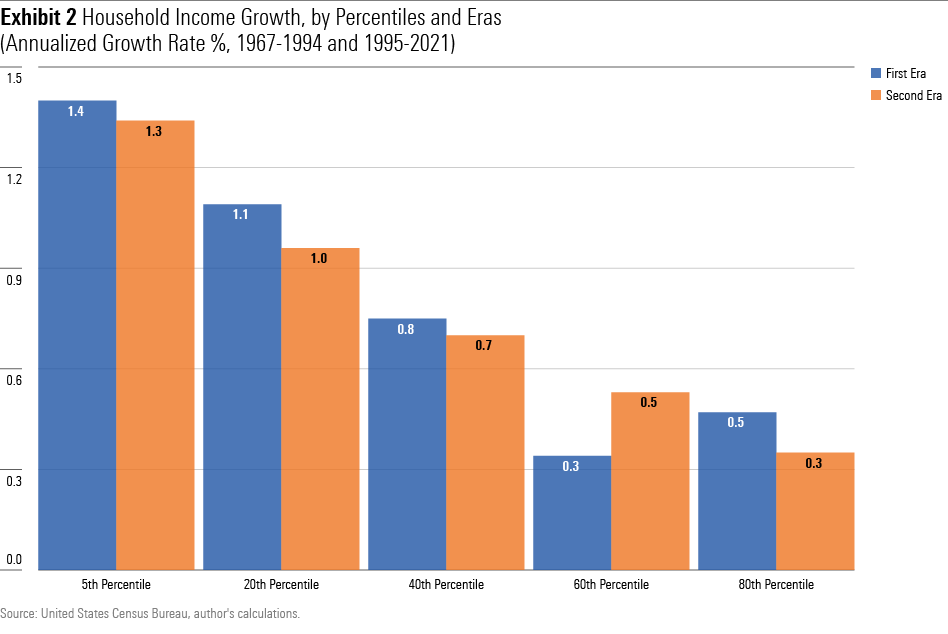
The outcomes were consistent. The relative strength of higher-income households persisted across both halves of the divide, as (for the most part) did the amount of change for each displayed percentile. In all instances, the results were positive. Households grew richer, not poorer.
This condition held for shorter time periods, too. For example, even the 80th-percentile households—which, as we saw, enjoyed the smallest gains—became wealthier each decade. Their incomes were higher in 1977 than in 1967, then higher in 1987 than in 1977, and so forth until 2017. The effect was stronger yet for the other income percentiles.
More for Less
Thus far we have only examined the second term of the two-word phrase “household income.” Left unaddressed has been the change in the size of American households. The next chart illustrates, over time, the percentage of U.S. households that contained: 1) one person, 2) two people, and 3) three or more people.
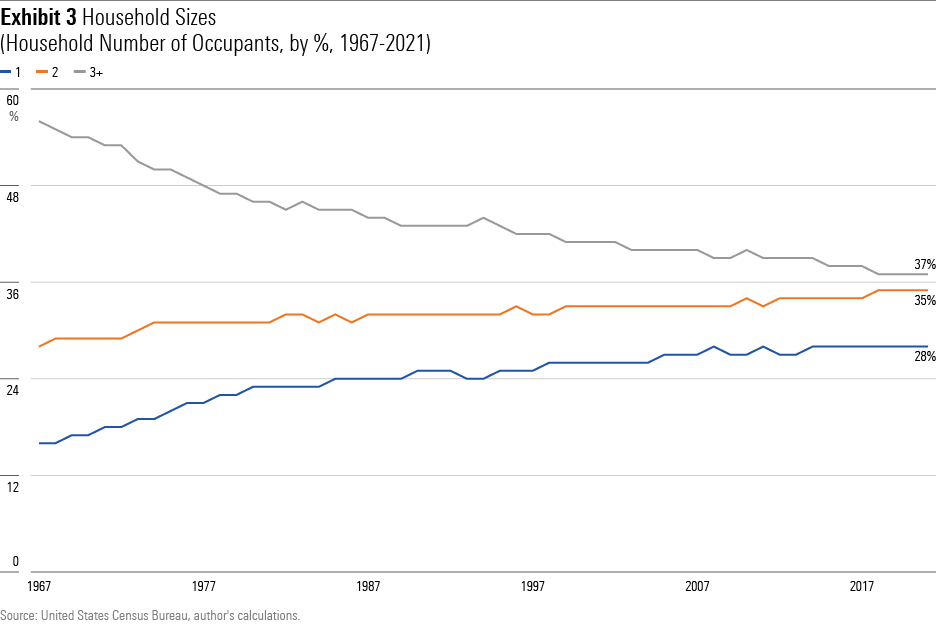
You get the picture. (Literally.) The amount of people maintained by those household incomes has dropped dramatically. Whereas 56% of households in 1967 consisted of three of more people, only 37% of households now meet that description. Meanwhile, the number of single-person homes has risen to 28% from 16%. Today’s households not only earn more money, but they also have fewer mouths to feed.
In short, history suggests no reason why Americans should be pessimistic about their financial futures. (In addition to household incomes, I also researched labor-productivity growth, which decided against presenting because it tells a similar story.) It would be a shocking and dramatic reversal if their fears proved correct.
Collective Wisdom?
Perhaps, one could rebut, the poll’s result reflects the wisdom of the crowd. After all, in demonstrated in various experiments, for example guessing the weight of an ox or the amount of jelly beans in a jar, the estimates obtained by averaging the group’s opinions are remarkably accurate. (Hurrah for socialism!) Could that also hold for NORC’s poll?
That seems very unlikely, because the comparison is flawed. Averaging numerical estimates is a different exercise than summing yes-or-no answers. The former process adds insight by, in effect, offsetting the individual error terms. The latter does not. Also, even a cursory glance at the public’s past predictions is enough to destroy one’s faith in communal foresight.
For example, 74% of respondents to a 1990 Gallup Poll (no link available) expected the rate of inflation to accelerate during the next decade, 71% believed that crime would rise, and 67% expected greater poverty. Whiff, whiff, whiff. Indeed, the crime-rate prediction was so breathtakingly mistaken that I cannot resist showing the actual results.
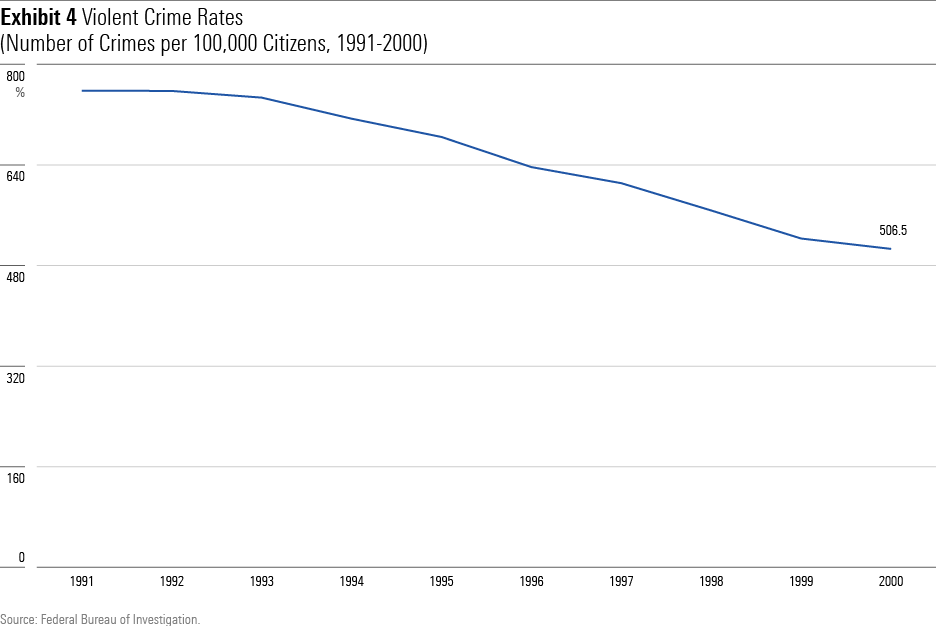
The decade that the people thought would bring more crime delivered exactly the opposite: the greatest crime reduction in modern (and perhaps all) American history. Despite public perception, the crime trend has since continued, when viewed broadly. The national violent-crime rate per 100,000 citizens, according to the FBI, was 758 in 1991, 507 in 2000, and 396 in 2021.
Summary
I know not why Americans are so pessimistic about their financial futures. Some speculate it’s because the country has lost its moral path. Others blame a culture of negativity caused by warring politicians and/or the isolating effects of technology. Whether those theories are correct is a topic for massive studies, not a 1,000-word column.
But I do know that in doing so, the people are almost certainly wrong. One needn’t be a table-pounding capitalist or a blind apologist for all things American to accept the fact that for 250 years, the nation’s economic system has always found a way to move forward. That trend is very likely to continue.
The author or authors do not own shares in any securities mentioned in this article. Find out about Morningstar’s editorial policies.
:quality(80)/cloudfront-us-east-1.images.arcpublishing.com/morningstar/5PG7DO2I43KSWYJNHK47D4JN7M.png)

:quality(80)/cloudfront-us-east-1.images.arcpublishing.com/morningstar/JIZ7XPQ4FK7TGXNX42XRYN4GZM.png)